When to use Tableau (or a classic BI tool) vs. when to use Datawisp
With the advent of genAI and LLMs, companies are starting to explore new software and how it can help them increase efficiency. For many companies, this is the first time they’ve thought about adding a secondary data analysis tool to their arsenal. We wrote this short guide to help anyone currently using Tableau (or a similar tool such as PowerBI) decide what tasks they can handle with their current software and which ones Datawisp would be better for.

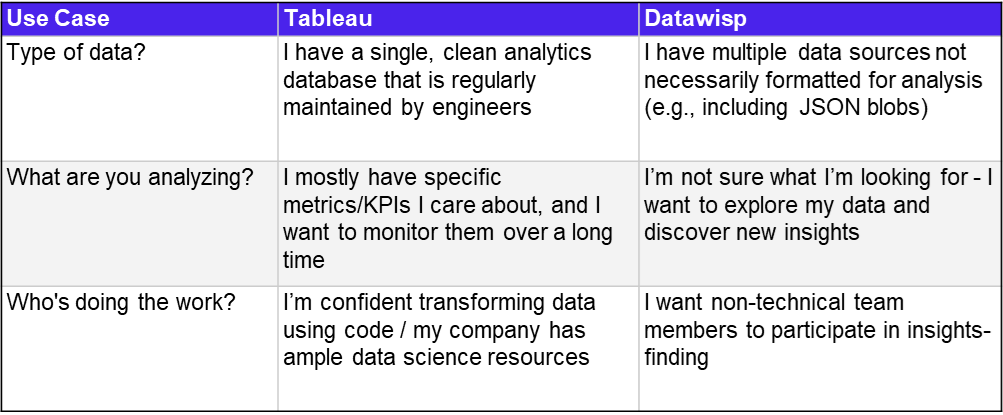
Tableau
I have a single, clean analytics database that is regularly maintained by engineers
I mostly have specific metrics/KPIs I care about, and I want to monitor them over a long time
I’m confident transforming data using code / my company has ample data science resources
Datawisp
I have multiple data sources not necessarily formatted for analysis (e.g. including json blobs)
I’m not sure what I’m looking for - I want to explore my data and discover new insights
I want non-technical team members to participate in insights-finding
What kind of data are you working with?
If you have engineering support to build and clean an analytics specific data set / view, Tableau is great. Most BI platforms work well with a constant set of features that are easily explainable and are already understood by your organization. But things like new features, name changes, and less massaged data sources can create difficulties.
Datawisp’s strength is being able to transform data on its own. You can plug your product data directly into Datawisp and start asking questions about it, without having a pre-built analytics specific view. No need to manually join, flatten JSON, etc. it just works.
What are you analyzing?
Do you have specific, known metrics that are pre-defined and just need to be visualized / monitored? If so, Tableau is great at this. Your data scientist can define these metrics and share dashboards with the rest of the organization.
On the other hand, if you’re not quite sure what it is you need the final metric to be, and need to experiment and iterate, then Datawisp’s exploratory nature makes it ideal. Datawisp lets you easily answer ad-hoc questions that your data team might not have time to. You can talk to Datawisp in plain English, just as you would with a data scientist, and ask any number of follow up questions until you find exactly what you’re looking for - or discover something unexpected! Datawisp is also useful for doing analysis that’s only relevant to your job - where general company dashboards won’t be useful.
Who’s doing the work?
If you’re a data savvy professional creating visualizations for your stakeholders, you may prefer to work directly in SQL with a tool designed for data scientists. In that case, Tableau is great.
If you’re a product manager, marketer, CXO, or anyone else whose primary role doesn’t involve having data skills, then Datawisp is for you. We built Wispy so you can answer data questions the way you’re used to - by asking someone else to do it for you!
In summary
Tableau and Datawisp can happily co-exist within the same organization! If your company is currently using business intelligence software like Tableau and you’re exploring ways to make data even more accessible within the company, let’s chat! Book a demo here or send us an email at hello@datawisp.io.